Previous Day High-Low Breakout Trading Setup
The Previous Day High-Low Breakout Trading Setup is very powerful if you understand market conditions. Before I explain further, there are two conditions that must be met before you consider opening a position.
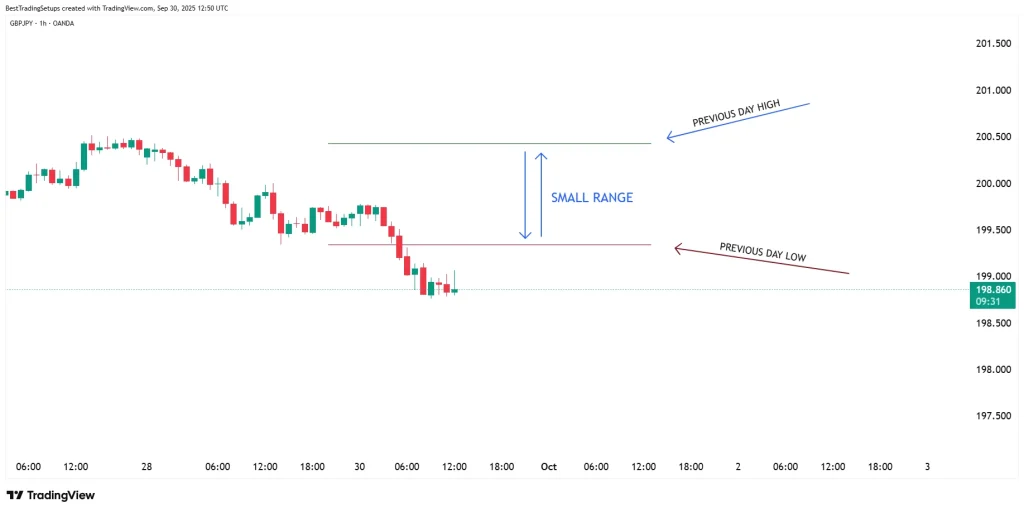
- The previous day’s high and low range should be small. If the range is too large, there’s a higher probability that price will bounce back and forth between those levels
- For a valid entry, you need to wait for a candlestick to break and close below the previous day’s low for a sell, or break and close above the previous day’s high for a buy.
In this example I use Previous days highs and lows indicator at TradingView
The idea behind
The idea behind this breakout is simple: the price was consolidating the day before, and once it breaks the highest or lowest point, there is a high probability it will continue in that direction. In our case, once the price breaks the lowest point—the previous day’s low—it tends to follow a bearish direction.
Breakout conformation
The image below represents the 1H time frame. As you can see, the breakout is clear. Only consider a trade setup once the candle breaks and closes below (for a sell). The opposite applies for a buy.
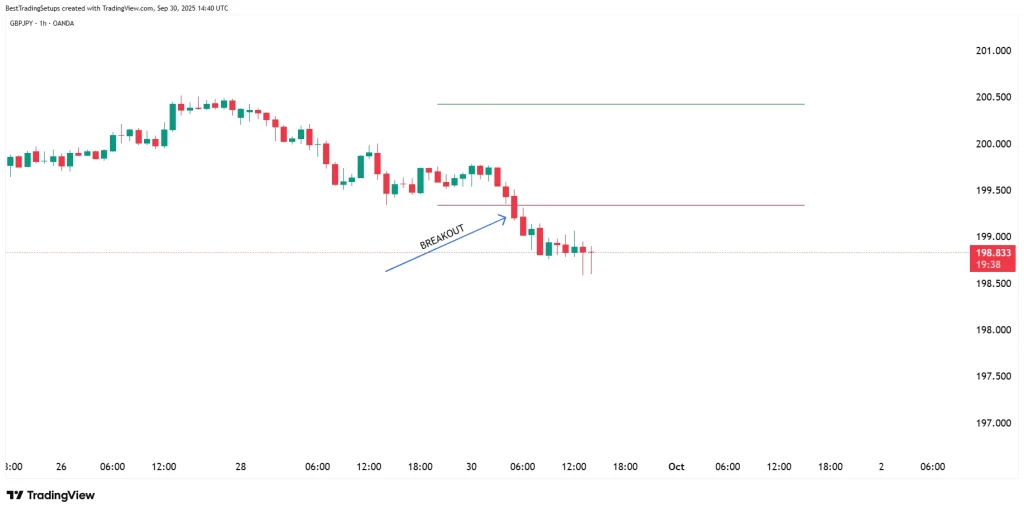
You don’t want a candlestick that is too long and closes far from the previous day’s high and low levels. The breakout needs to be clear; in our example, this candle is perfect.
Conformation on smaller time frames
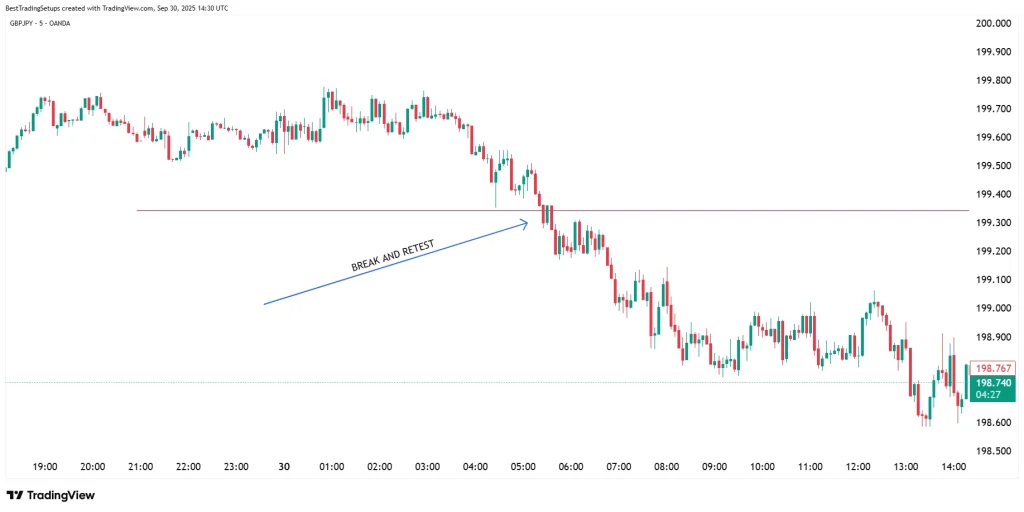
While I like to see a clear breakout on H1 or H4 time frames, I usually also check smaller time frames for a more precise entry. In this example, the M5 candlestick clearly breaks and closes below the previous day’s low. I never suggest beginners take the first breakout as an entry—always wait for a retest (on smaller timeframes). After the first candle breaks, the second bullish candle retests the level and tries to break above. When it fails on the third attempt, it confirms a successful breakout, after which the price continues to push lower.
Important
Always try to have additional confirmation before taking a setup. The trend from the bigger picture—daily and weekly time frames—should be in the same direction. Some traders use COT data to support the right direction.
For example, if the price has just broken the previous day’s low and the daily and weekly candlesticks are bearish, this could provide additional confirmation to enter a sell trade.
Cons
The biggest enemy of this setup is that many traders are looking to trade reversal setups at the previous day’s high and low levels.
If you have any questions regarding the Previous Day High-Low Breakout Trading Setup, you can send us an email.